
SLA Report Metrics
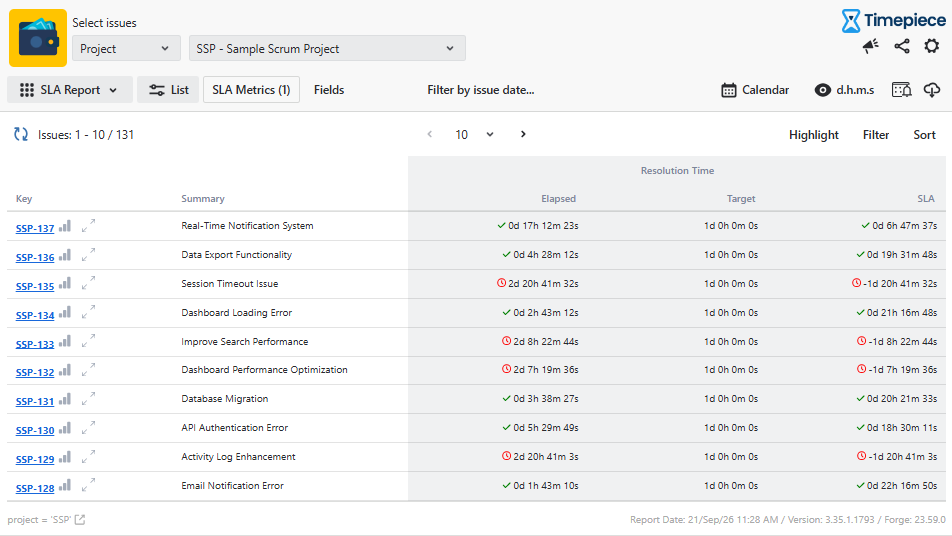
The SLA Metrics report lets you define SLA metrics that run between two points in an issue’s lifecycle against a target and show whether each metric succeeded or failed, along with the elapsed/remaining time.
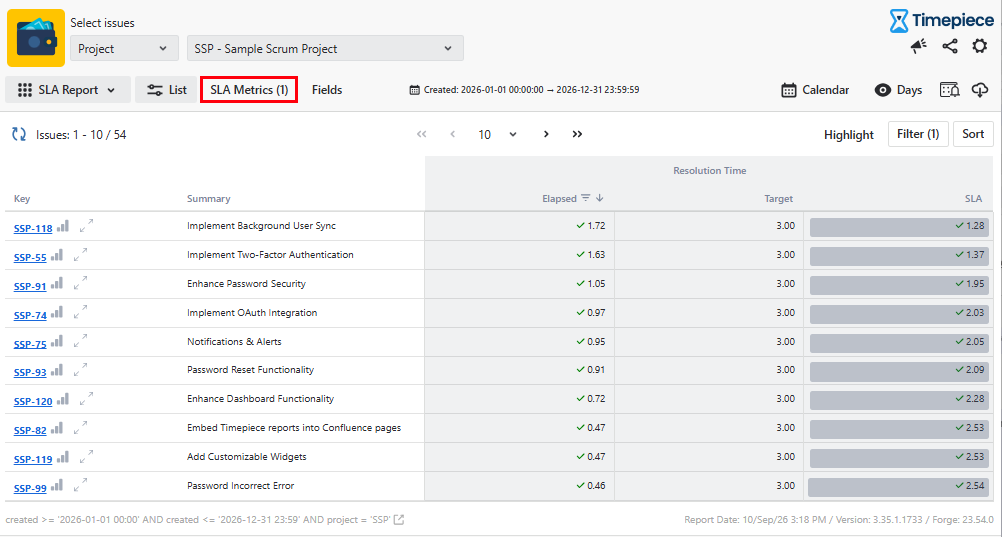
The SLA Metrics button appears only when the SLA Report report type is selected. This button opens a panel that allows you to define one or more SLA metrics.
Metric Definitions
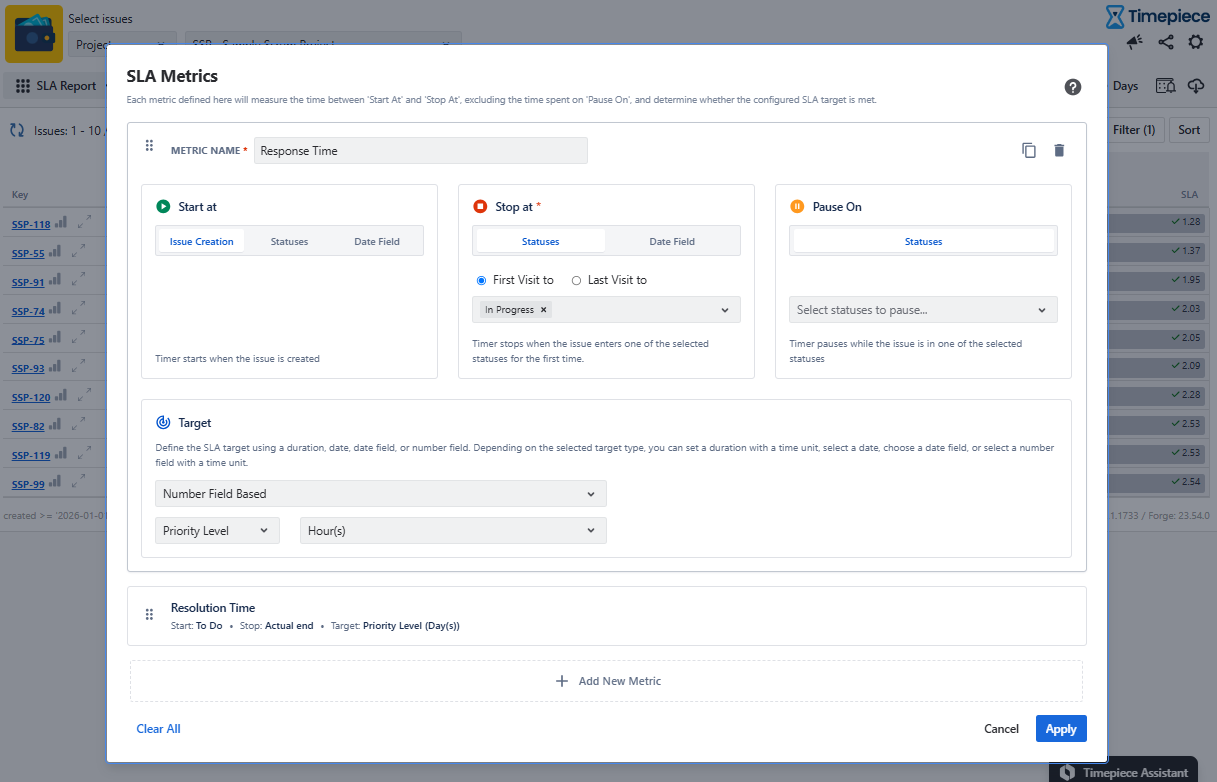
Name
The Name will be used as the column header for the metric.
Start At
Start At marks where the metric will start counting and has three options:
“Issue Creation” means the metric’s starting point is the moment the issue was created.
“Statuses” means the metric starts with the transition to a status. Select one or more statuses and the metric starts when the issue enters any one of the selected statuses. If your workflow allows issues to visit the same status more than once, the “First transition to / Last transition to” selection allows you to start the metric at the First or Last visit to a status. (If an issue visits a status only once, selecting first or last won't make a difference.)
Selecting a “Date field” starts the metric on the date specified in the selected date field of the issue. This makes it possible to set a different start date for each issue. This is particularly useful when the start condition is not pre-defined but is negotiated between stakeholders.
Stop At
Stop At marks where the metric will stop counting and has two options:
“Statuses” means the metric stops with the transition to a status. Select one or more statuses and the metric stops when the issue enters any one of the selected statuses. If your workflow allows issues to visit the same status more than once, the “First transition to / Last transition to” selection allows you to stop the metric at the First or Last visit to a status. (If an issue visits a status only once, selecting first or last won't make a difference.)
Selecting a “Date field” stops the metric on the date specified in the selected date field of the issue. This makes it possible to set a different stop date for each issue. This is particularly useful when the completion condition is not pre-defined but is negotiated between stakeholders.
Pause on
Pause on selects where the metric will temporarily stop counting and only works with statuses.
You can leave this one empty or select multiple statuses here. The metric will pause counting on these statuses and will resume counting when the issue exits these statuses.
Target
In the Target section, you define the target for the SLA metric. There are four options:
Duration Based
For the Duration Based option, you set a fixed numeric value as a target, and all issues in the report will have the same target. For example, if you set 3 days, all issues in the report will run against a target of 3 days. (This is very similar to how Jira Service Management SLAs work.)
Number Field Based
The Number Field Based option allows creating dynamic (per-issue) numeric targets. You select a numeric field of the issue (and a unit) that will set the target for each issue. Each issue’s metric in the report will run against the target set in that field on the same issue. This is particularly useful when the target time is not pre-defined but is negotiated between stakeholders.
Date Field Based
The Date Field Based option allows creating dynamic (per-issue) date targets. You select a date field of the issue that will set the target for each issue. Each issue’s metric in the report will run against the target date set in that field on the same issue. This is particularly useful when the target completion date for each piece of work is not pre-defined but is negotiated between stakeholders.
Date Based
For the Date Based option, you set a fixed date and time value as a target, and all issues in the report will have the same target. For example, if you set “Jan 1st, 2026 00:00”, all issues in the report will run against this target date. In practice, all issues will have a different time target (based on the date the issue is created or transitioned to a start status).
Metric States
Not Started
These are the metrics that haven’t reached the starting point yet. For these metrics, no values are displayed in the report.
Running
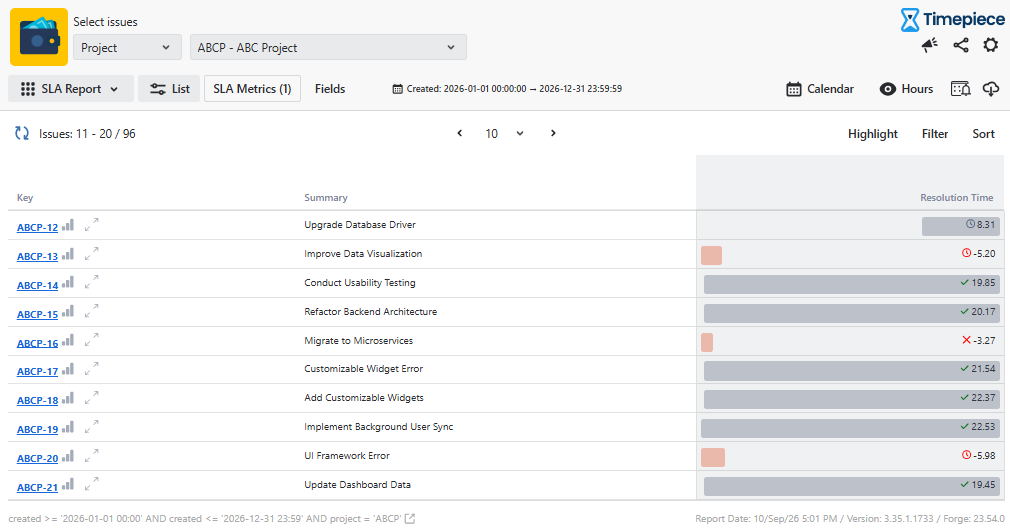
These are the metrics that have reached the starting point but haven’t reached the stop point yet. For these metrics, a value is displayed in the report, and the time is measured up to the present moment. An icon next to the value indicates the current SLA status:
-
-
Gray clock (

-
Red clock (

-
Paused ( 
Completed
These are the metrics that reached the starting point and then reached the stop point. For these metrics, a value is displayed in the report, and an icon next to the value indicates whether the metric was completed within or exceeded the defined target:
-
-
Green check (

-
Red cross (

-
Show SLA Details
The Show SLA Details toggle is available in the View Format panel when an SLA report is displayed.
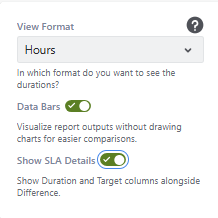
When Show SLA Details is disabled, only the SLA column is displayed for each SLA metric.
When Show SLA Details is enabled, two additional columns (for Elapsed and Target) are also displayed for each SLA metric in the report.
For more information on reporting SLA breaches and receiving scheduled email reports, see How to Get Alarms for SLA Thresholds.