
This article explains how to define a “First Response Time SLA” and receive alarms or notifications about this SLA's thresholds using Timepiece - Time in Status for Jira.
Business Scenario
The company wants to track whether customer requests receive a first response within 4 hours. The team lead needs regular updates on SLA performance to identify overdue requests and track ongoing work.
Requirement
Checking SLA performance manually requires generating the report whenever an update is needed. The team needs a way to receive report results at regular intervals without repeating this process.
Solution
Timepiece can create SLA reports and can send alarms or notifications by email at predefined intervals through its Scheduled Reports capability.
In this example, the support team monitors first response times against the defined SLA target, and the team lead reviews the reports to identify SLA breaches and spot potential issues.
Step 1: Create an SLA Metric
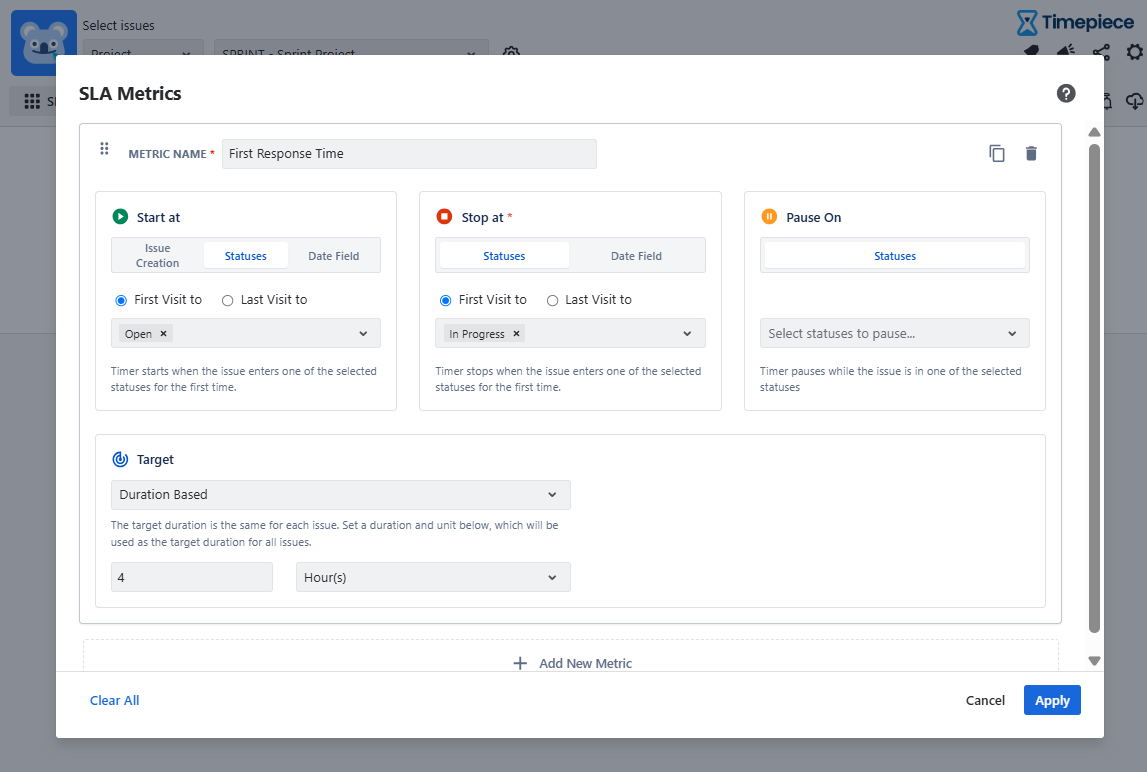
First, create an SLA metric to measure the time to provide the first response to customer requests and set a 4-hour target, meaning requests must receive a first response within 4 hours to meet the SLA.
-
Open the Timepiece reporting page.
-
Select the project in which the work items reside.
-
Switch to the SLA report type.
-
Open the SLA Metrics panel and add a new SLA metric.
-
Start At: Open
-
Stop At: In Progress
-
Duration Based Target: 4 hours
-
Step 2: Generate the SLA Report
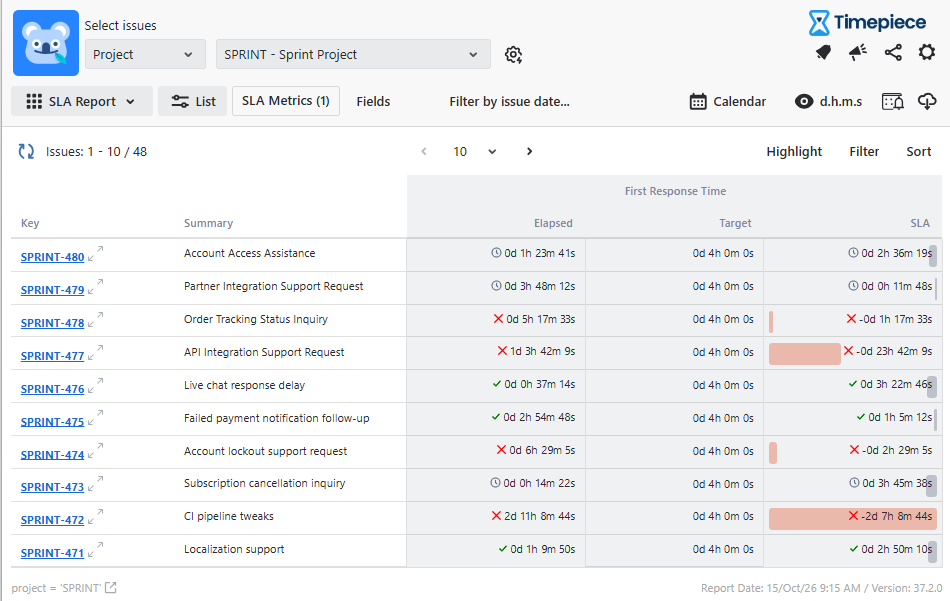
Generate the SLA Report to view first-response results for support work items.
The report shows whether customer requests received a first response within the four-hour SLA target. This provides an overview of the support team's first response performance and helps identify requests that have breached their SLA targets.
Step 3: Define Report Scope with Custom JQL
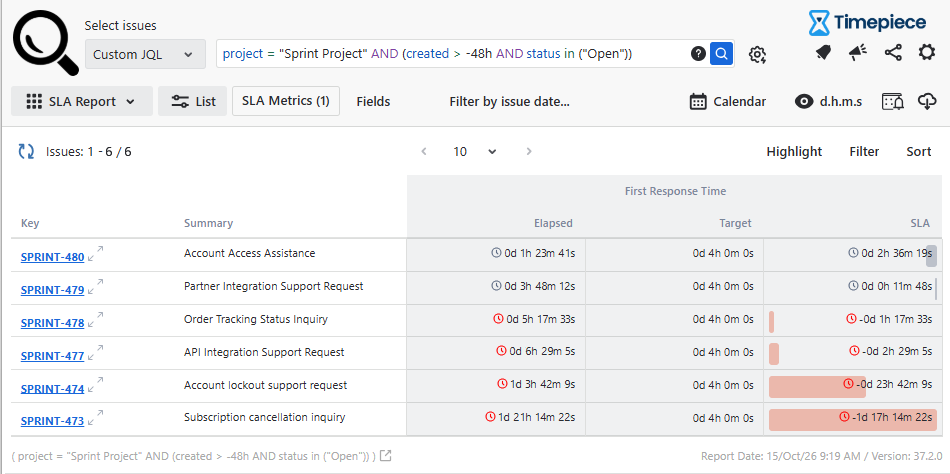
Refine the report scope to focus exclusively on active customer requests that require immediate tracking. (Since this report will be run frequently, we would want to avoid processing a huge number of issues each time.)
-
Click the Select issues dropdown and select Custom JQL.
-
Enter the query
project = "Sprint Project" AND (created > -48h AND status in ("Open"))to isolate requests created within the last 48 hours that are still awaiting a first response. -
Click the search icon to refresh the SLA report view.
Step 4: Filter At-Risk and Breached Requests
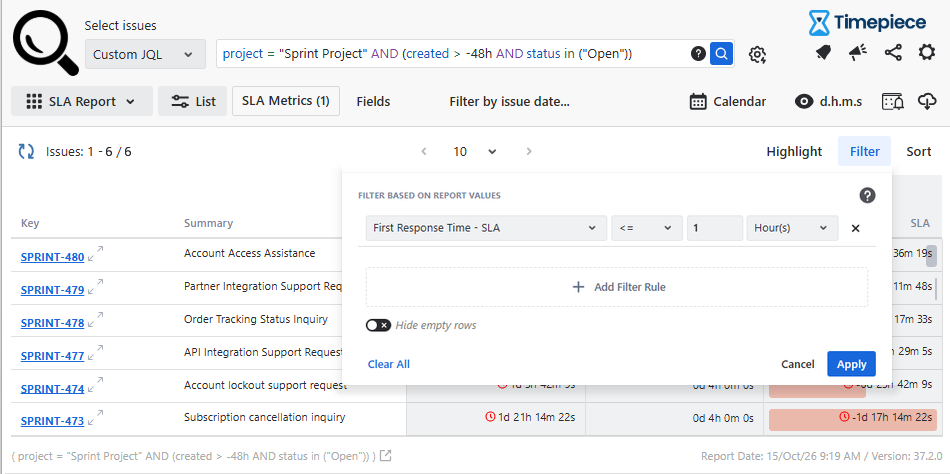
Apply a report-level filter to narrow down the view to urgent customer requests that have either breached their SLA target or are at risk of breaching it shortly.
-
Click Filter at the top right of the table.
-
Under Filter Based on Report Values, set the condition for First Response Time - SLA to
<= 1 Hour(s). -
Click Apply to filter requests with 1 hour or less remaining on their SLA, as well as those that have already exceeded the 4-hour target.
Step 5: Save the Report Parameters
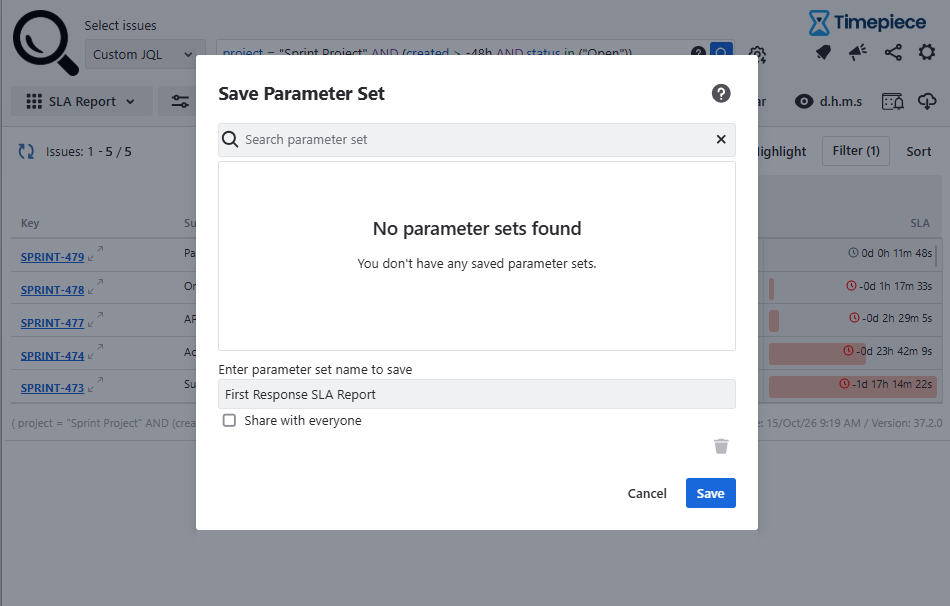
Save this report configuration by selecting Save Parameter Set. Saving the report is necessary to create a Scheduled Report.
Step 6: Create a Scheduled Report
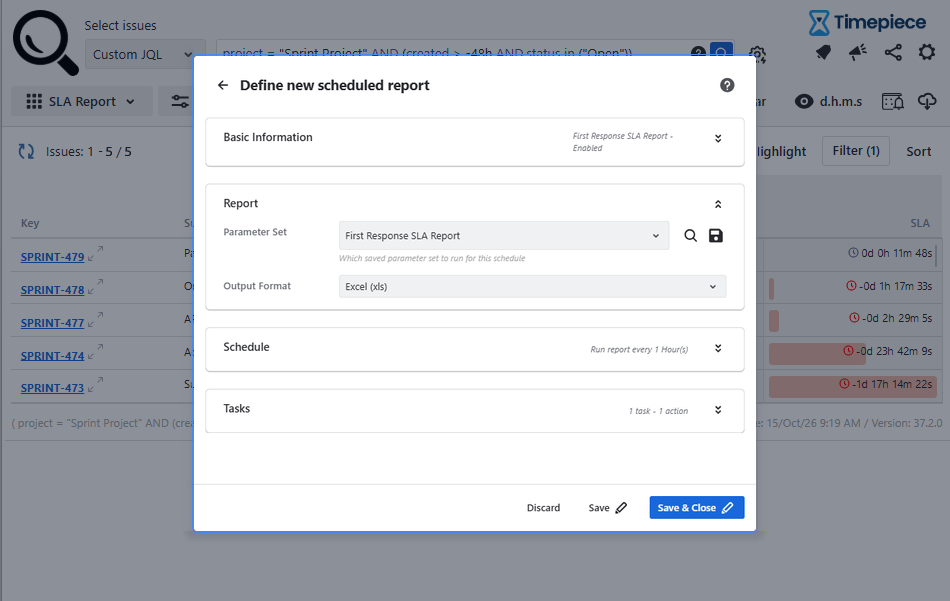
Once the report parameters are saved, create a Scheduled Report to receive the report by email at regular intervals.
-
Click the Scheduled Reports & Alarms icon at the top of the page.
-
Click Create New.
-
Select the saved report “First Response SLA Report” from the Select Parameter Set dropdown.
-
Configure the schedule with the required settings.
-
Configure the schedule settings to run every 1 hour.
-
Under Tasks, set "When should this task run?" to "Run this task when the report has at least 1 row".
-
Save and enable the schedule.
(Select "Run this task when the report has at least 1 row" option if you only want to receive emails when there is something to alarm about. If no issues meet your filter criteria, no email will be sent.)
Step 7: Review the Scheduled Email Reports
Once the scheduled report is sent, the recipients can review it in their inboxes.
For more information about configuring SLA metrics and targets, see SLA Metrics.